In my post Ignore My Financial Advice, one of my tips was to read financial history. One aspect of financial history I’d like to address is this baby-boomer nonsense that the stock market always goes up in the long term.
I guess that depends on what you consider the long term.
Before anyone invests in the stock market, they should look at two charts. One chart shows a secular bull market. Look at the DJIA (Dow Jones) chart from 1982 - 2000.
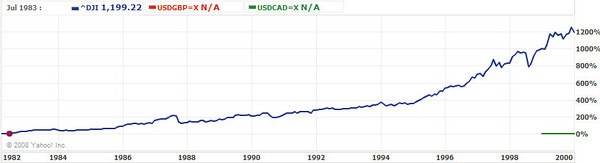
It is a beautiful chart. You’ve probably seen it before. This is the case for buying equities. Stocks moved from being way undervalued to way overvalued. Everyone was making money.
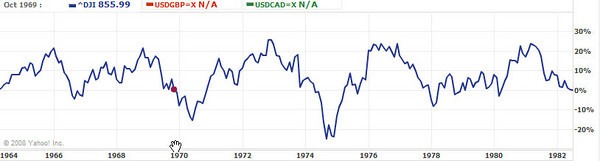
The second is chart is what happened just prior to the above chart. It is the DJIA from 1964 to 1982. During this period stocks moved from being overvalued to undervalued. This is a secular bear market. Prices move in a choppy pattern and after many heart-wrenching years, ended up back where they started. Add inflation and lost investment opportunities and you can see the damage caused by a bear market.
Fast forward to the present. Are we in a secular bear market now that started in 2000? Or are we in a secular bull market that started in 2003? Or maybe all this history is just noise and everything is different this time?
If you are interested in this topic and want a textbook education, read Unexpected Returns: Understanding Secular Stock Market Cycles by Ed Easterling. If you just want the basics, some of Ed’s best work made it into Bull’s Eye Investing: Targeting Real Returns in a Smoke and Mirrors Market by John F. Mauldin.