Although there are several good sources on the Internet for financial and economic information, if I had to pick my favorite it would be John Mauldin’s newsletter. The newsletter is free and is sent out twice a week, with John usually writing the Friday edition.
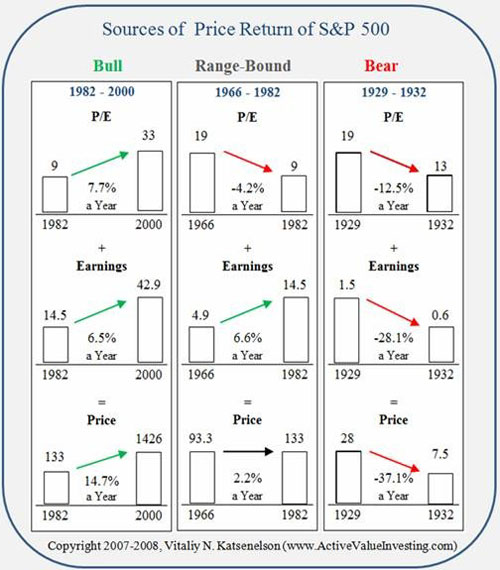
The most recent newsletter is titled Is it a Bull, Bear or Cowardly Lion Market? It has some beautiful charts that dissect returns over different time periods. Guest author Vitaliy Katsenelson then extrapolates patterns and characteristics. Prior to reading this article, I was under the impression after reading Ed Easterling’s book Unexpected Returns: Understanding Secular Stock Market Cycles that a secular bear market was range-bound. Vitaliy digs deeper into those time periods and then labels it range-bound. Interesting stuff.
The best charts can be found over at Crestmont Research. Be close to a high-quality color printer when you see these charts. It is a goldmine of financial data.
Comments
JOHN
April 14 at 2008 at 12:26 AM
A YEAR AGO THE PE RATIO OF THE S&P WAS 17. TODAY ITS 20. THE PE RATIO ON THE DOW A YEAR AGO WAS 18, TODAY ITS 52. MOST BEAR MARKETS LEAVE SHARE PRICES WITH LOWER PE RATIOS AND THEREFORE MORE VALUE.THIS BEAR MARKET, FOR NOW, SEEMS TO BE IN RETROGRADE.
Nick
April 14 at 2008 at 4:31 PM
And this helps you pick which individual stocks to invest in how?
MAS
April 14 at 2008 at 4:54 PM
The author is pushing a book to explain what he believes.
My personal opinion is it is too difficult to pick individual stocks in a secular bear market. History tells us to wait on the sidelines or in fixed income investments until P/E ratios over-correct to the downside.